


Excelgoodies logo +91 9176633248
Course on Power BI & RPA.

Full Stack BI& Desktop Automation — with AI

Power BI Adv.DAX MIS Reporting SQL VBA Web Scrapping API Integration Python Copilot Claude AI

  • Both Online & Classroom | 1 year (72 sessions, 2 hrs each)
  • 8 Certificates | 50+ Projects

(1.5K+ Professionals enrolled)

Prove you're human: Type the code shown.

=
Excelgoodies

Program Overview

Training Schedule

Tuesday, 11 Apr

View Schedule

1 year | 180 Hours

72 Sessions, 2 Hrs Each

Online & Classroom, Instructor-Led

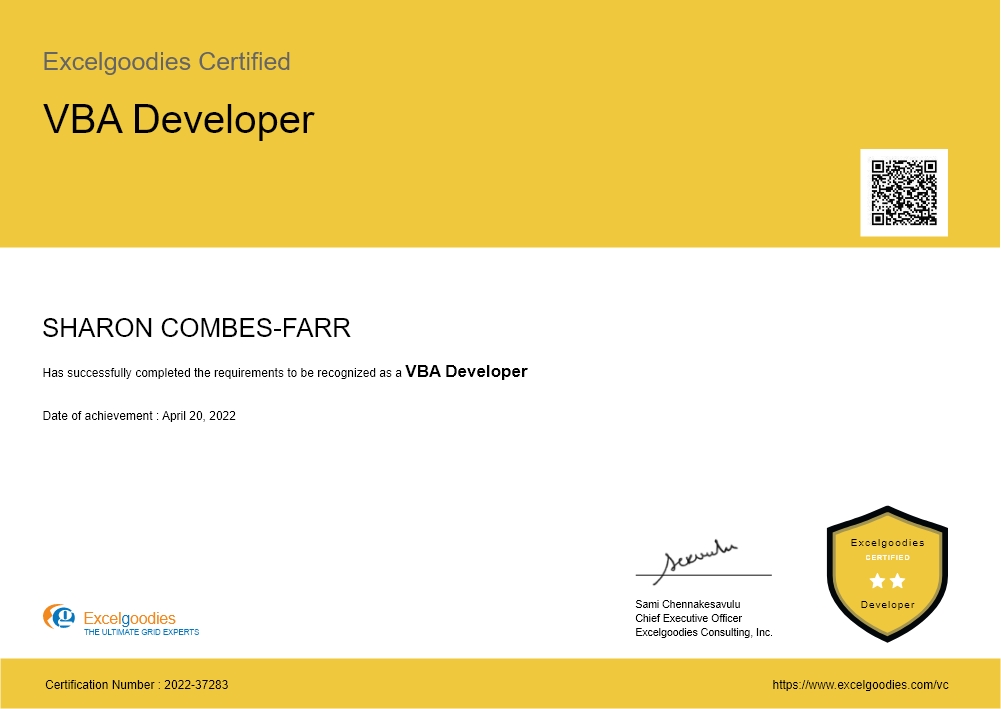
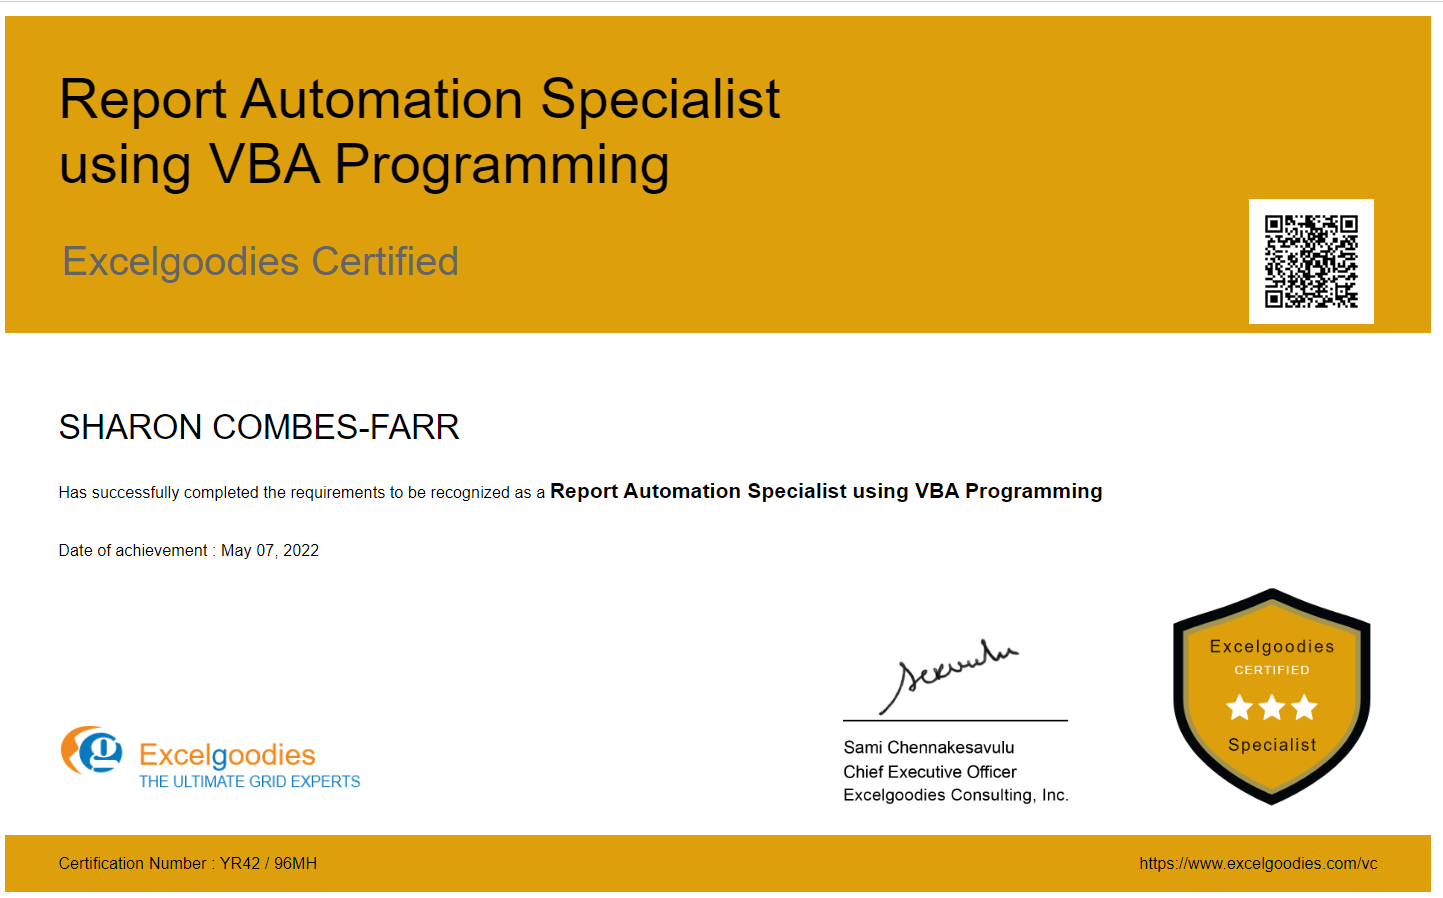
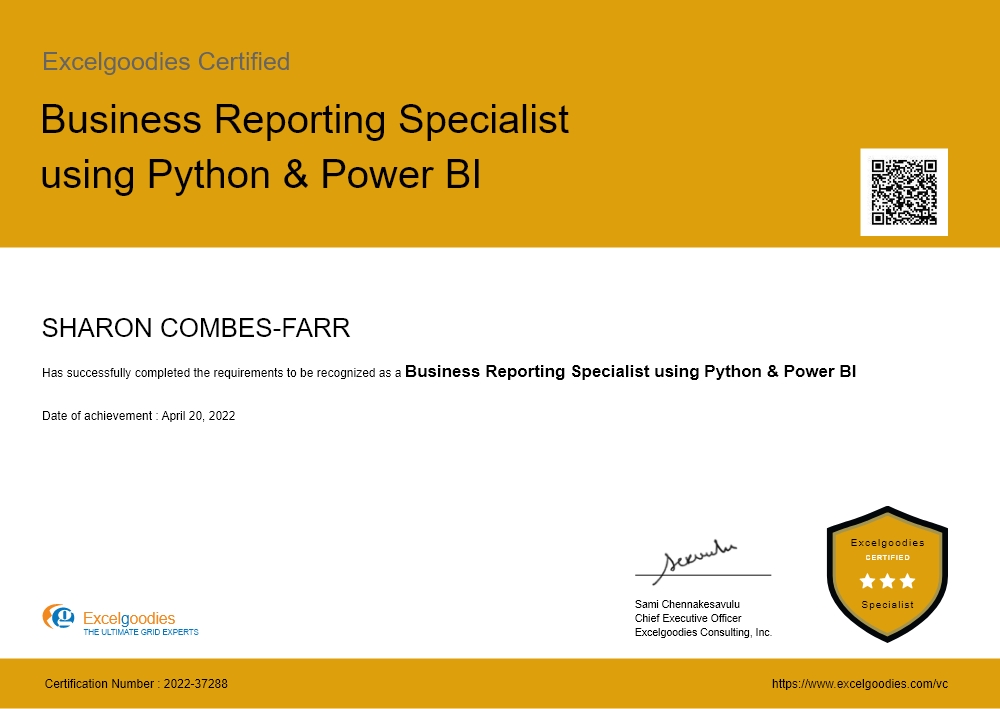
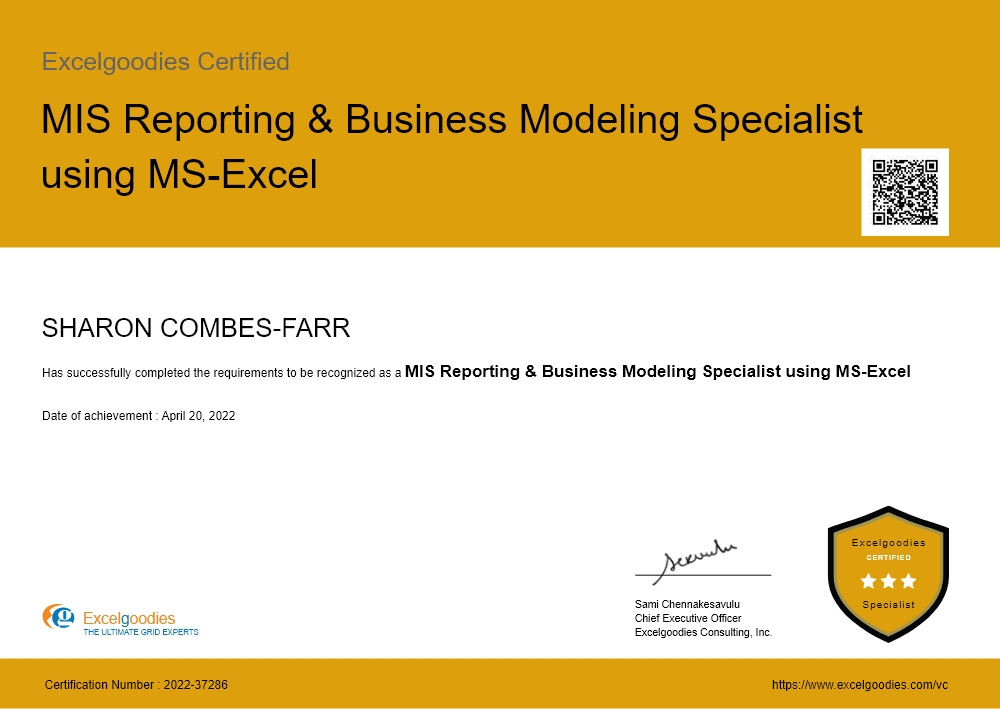
Certificates

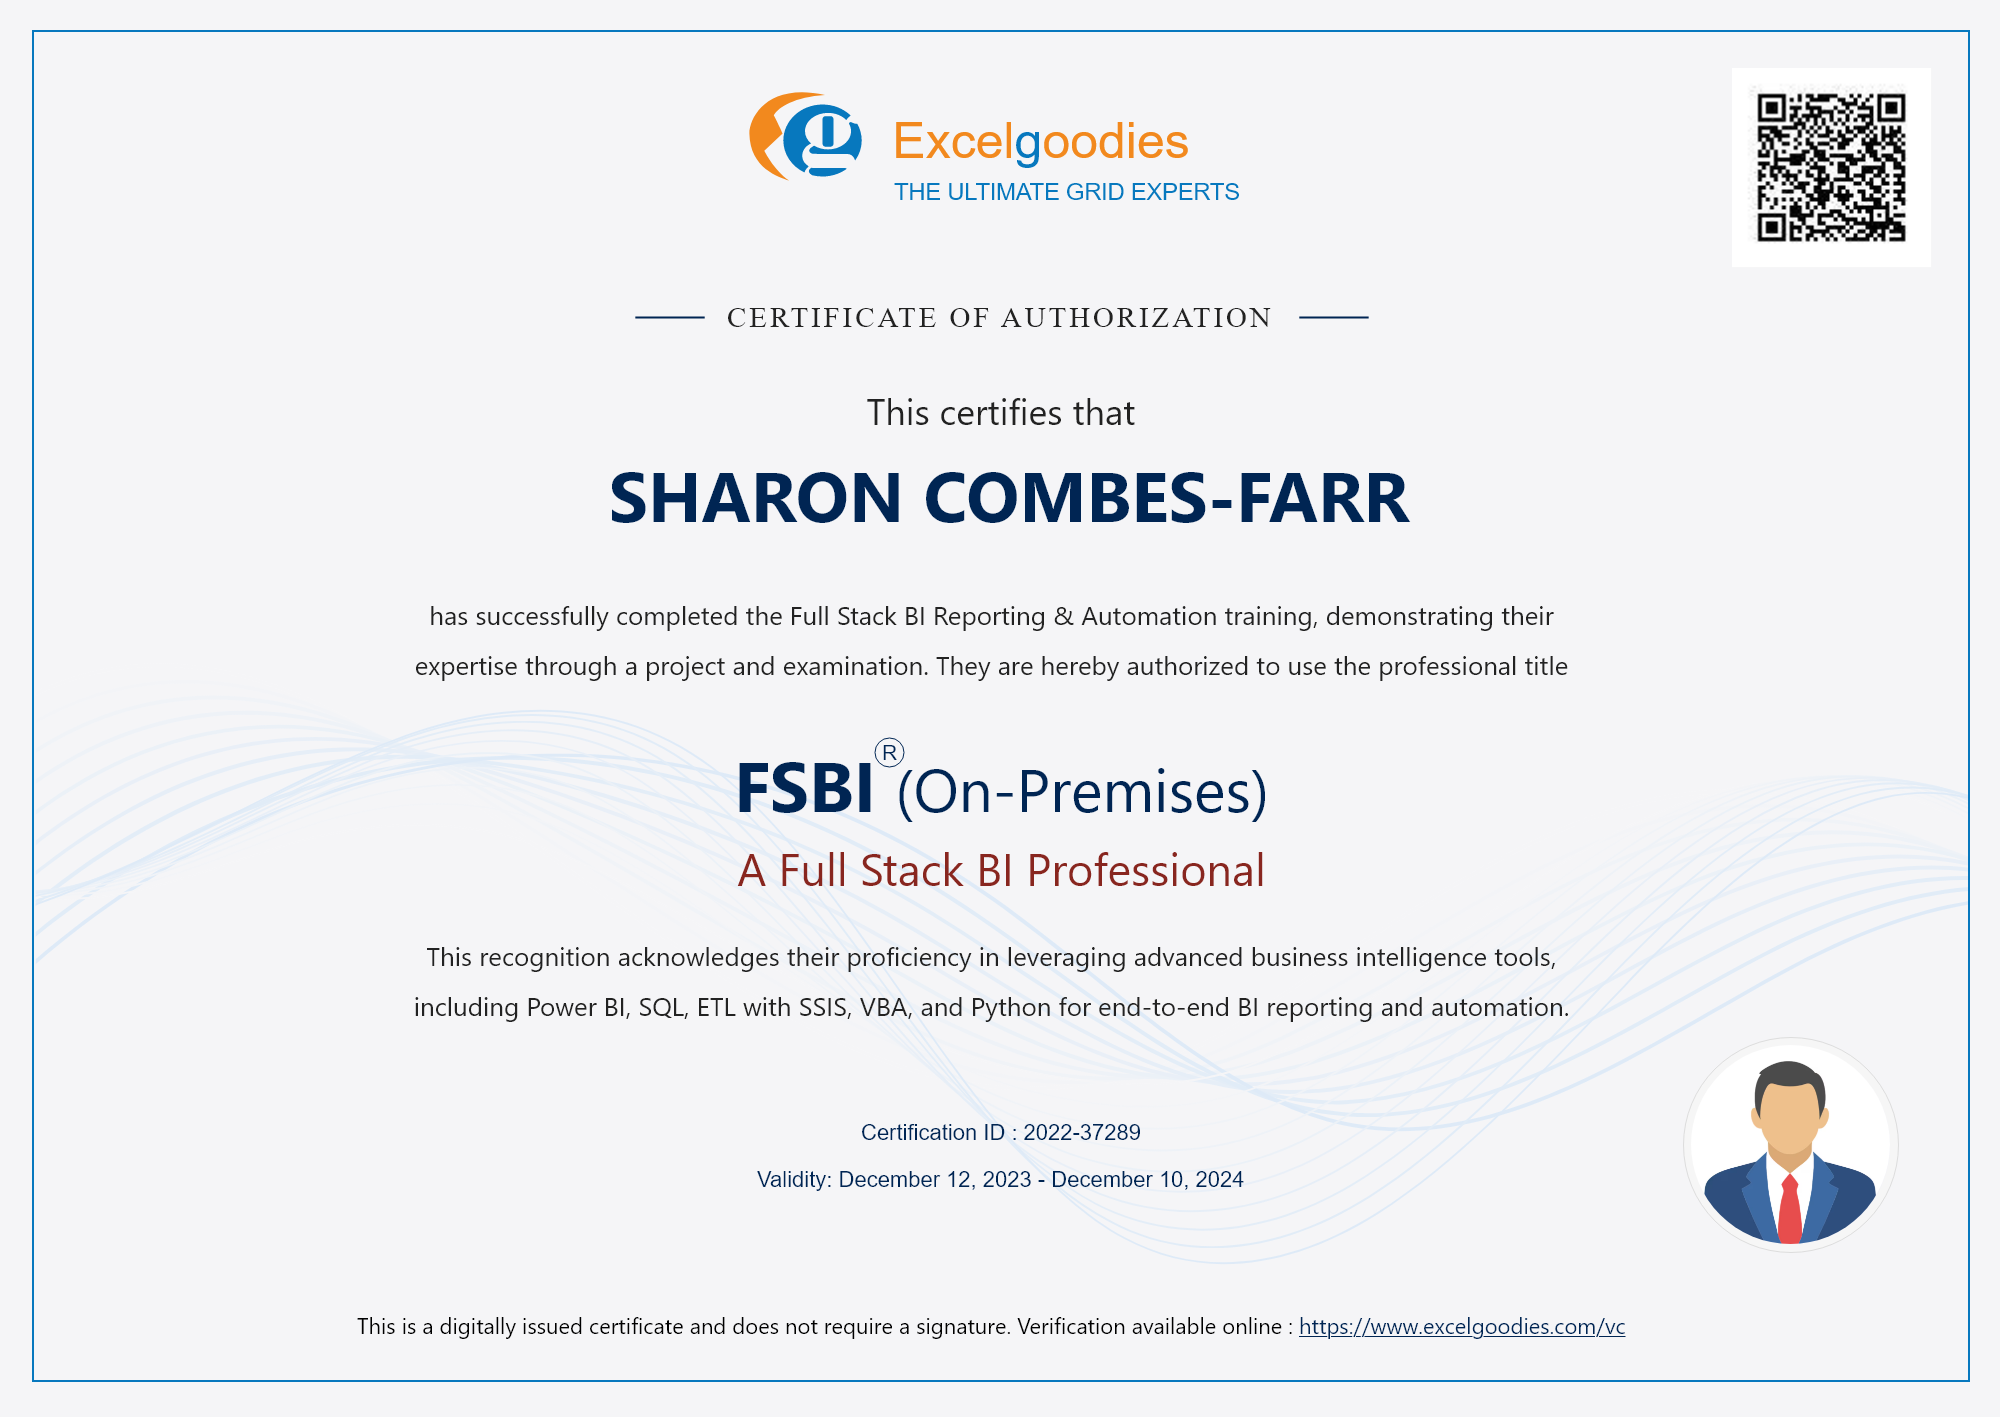
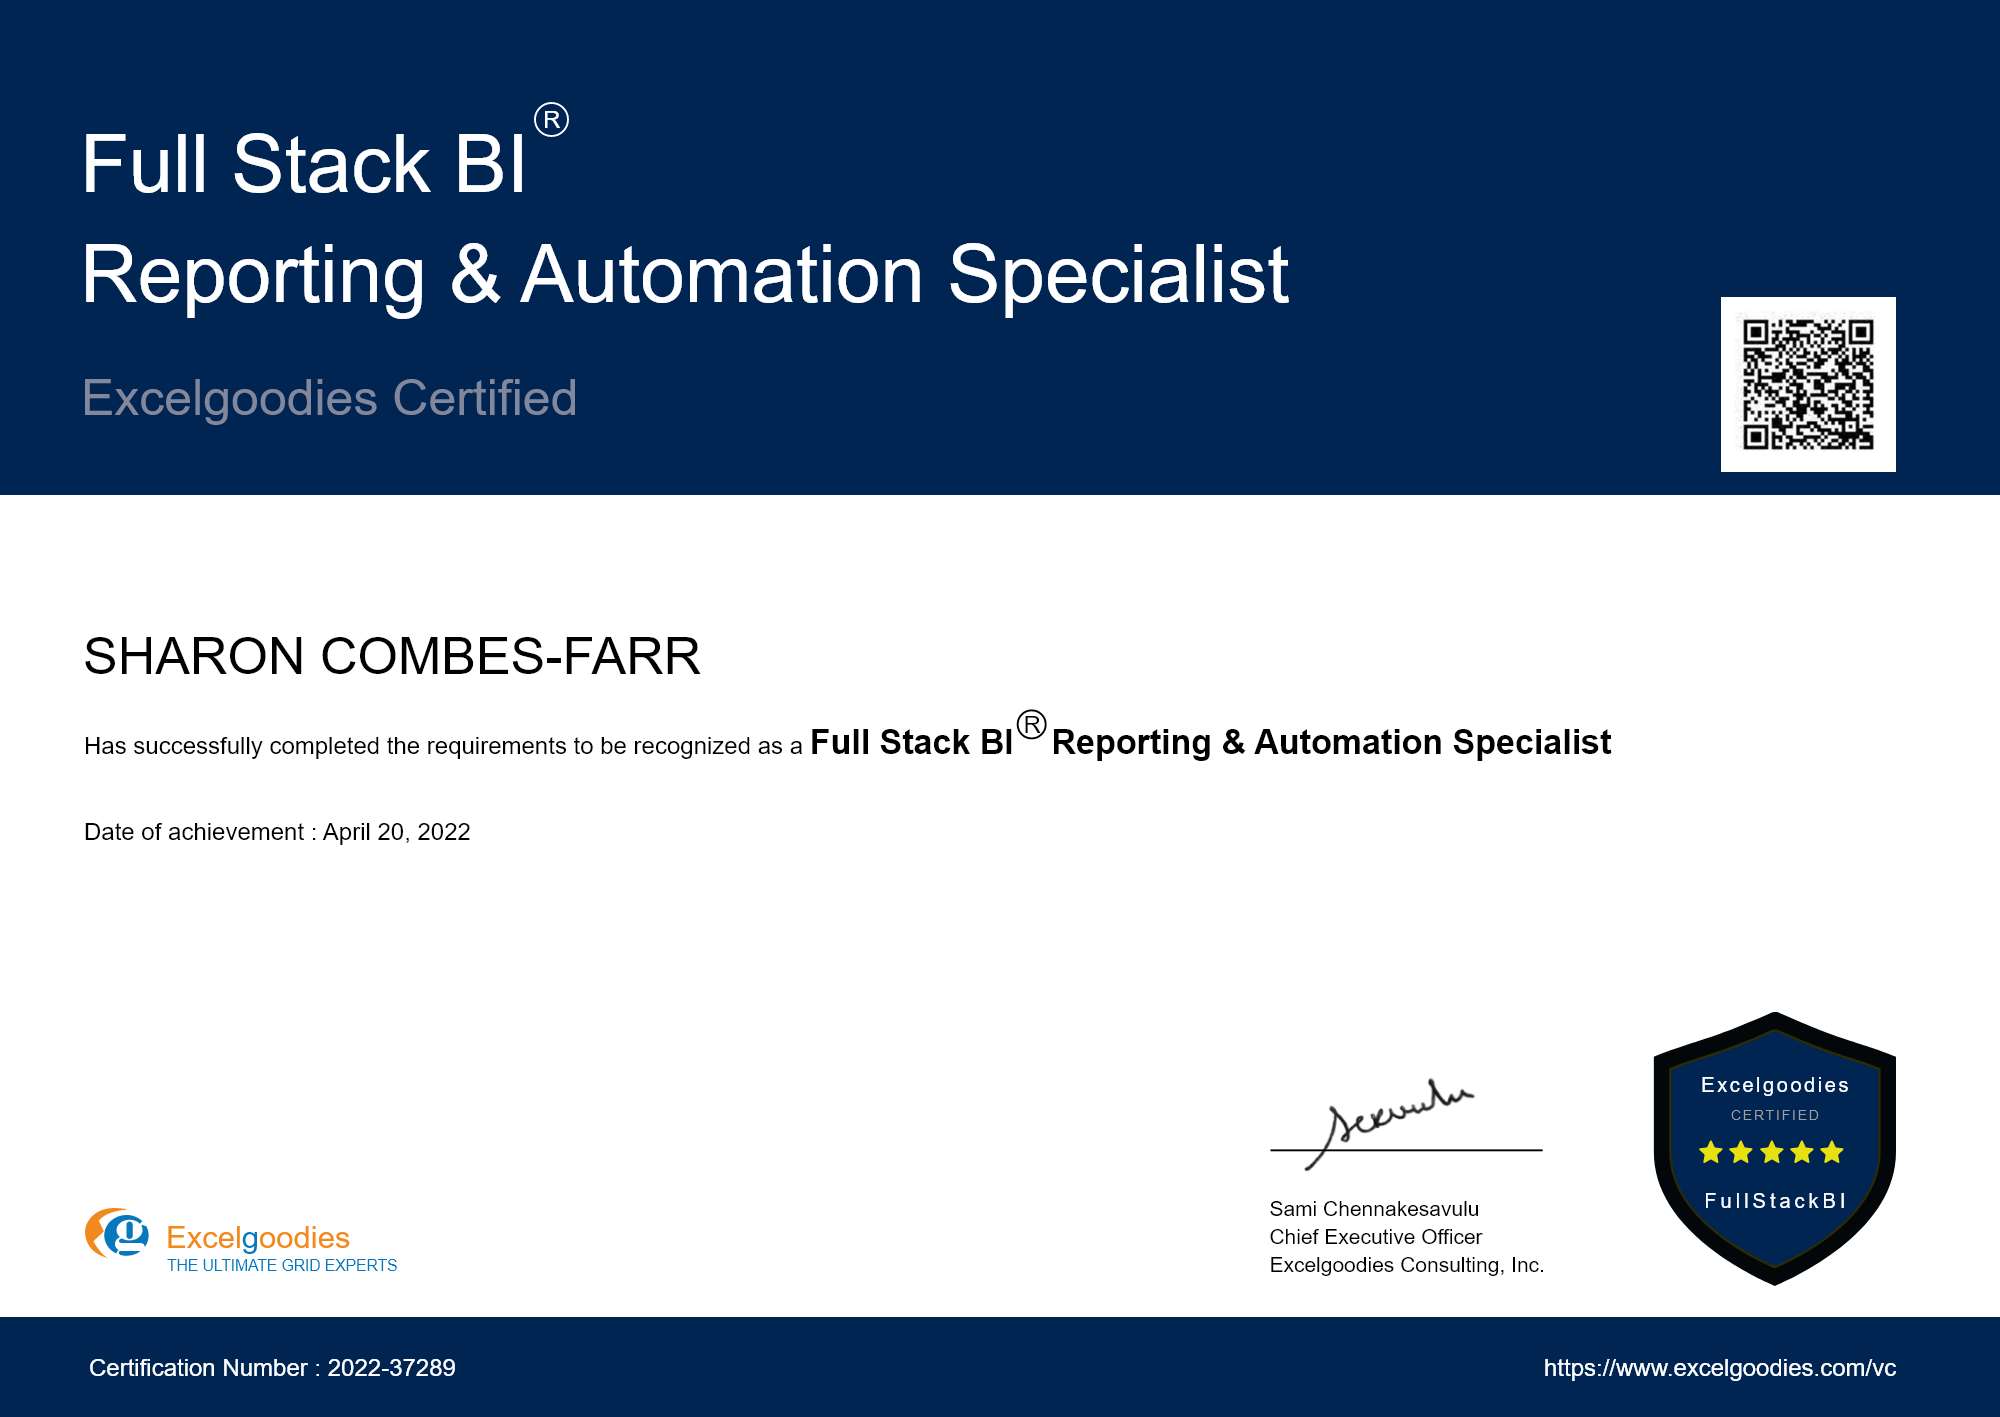
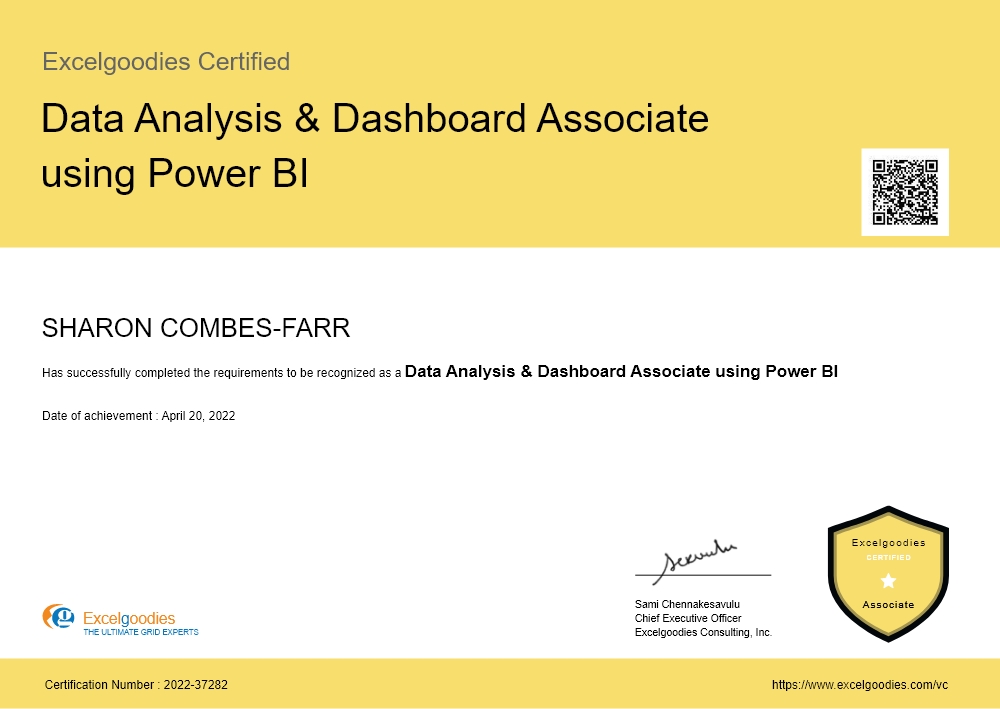
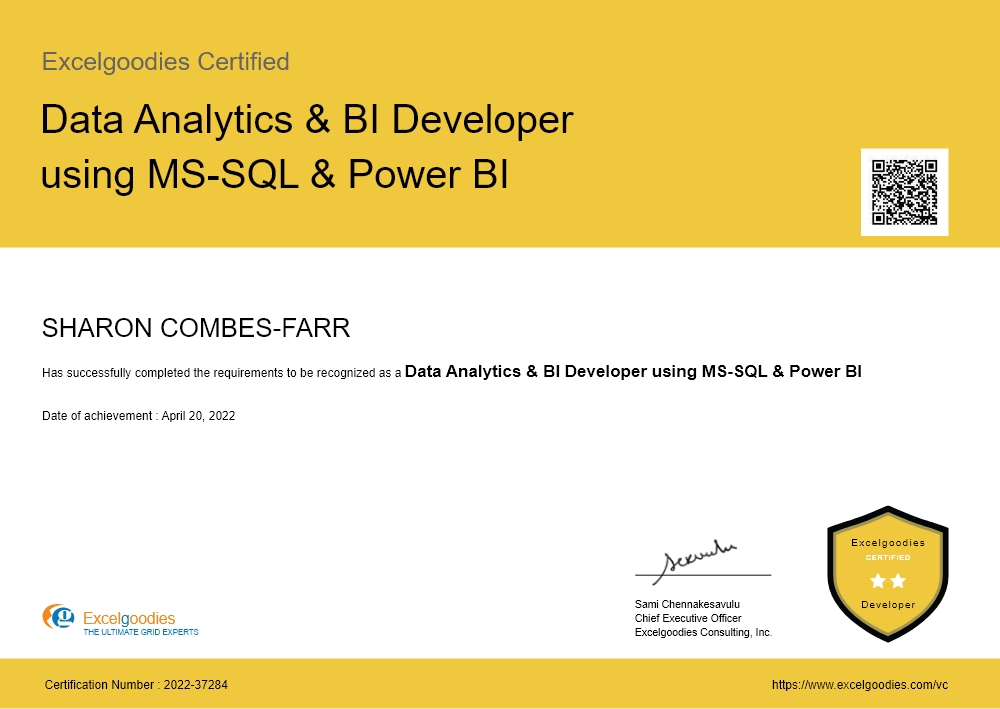
9 Specialist Certificates

View Certificate Details

Course Fee

₹4,000 / month

with initial fee of INR 15,000.

Full Stack BI & Desktop Automation — with AI

floating_menu floating_menu floating_menu

Batch starts on

th

Master On-Prem Tools

Power BI + MS-SQL + Automation = Smarter, Faster Workflows

Upgrade Your Reporting Game: Go Beyond Basics

Power BI alone won’t solve data bottlenecks—true BI expertise starts with a full-stack approach. This course is your first step toward mastering "end-to-end reporting," integrating SQL, automation, and scripting to transform fragmented data into scalable, self-sustaining BI solutions. Build a powerful on-premise BI system—"without IT dependence."

Tools You'll Learn

Data Analysis Tool

Microsoft Excel

Visualization & Reporting Tool

Microsoft Power BI

Data Modeling & Analytics Tools

Power Pivot, DAX

Data Transformation Tools

Power Query

Data Warehousing & Integration

MS-SQL

Automation & Scripting Tools

VBA

Scripting Language

Python

AI for Power BI

Copilot + Claude AI

In just 1 year, you'll be able to:

Think Like a Full-Stack BI Expert – Combine multiple data tools to build end-to-end reporting solutions.

Apply AI to Your Power BI Workflow – Use Copilot and Claude to speed up reporting, automate routine tasks, and validate your work.

Master SQL for Scalable Data Management – Query, clean, and structure data for efficient reporting.

Automate Reporting & Workflows –Streamline tasks with VBA, Power BI.

Leverage Python for Advanced Data Processing – Transform and enrich data for deeper insights.

Web Scraping with VBA – Automate data extraction from websites for seamless report integration.

Integrate & Optimize Multi-Source Data – Connect APIs, SQL, Excel, and web data into unified BI systems.

Build Scalable, IT-Free BI Solutions – Deliver self-sustaining reports and automation-driven dashboards.

In just 1 year, you'll be able to:

Think Like a Full-Stack BI Expert – Combine multiple data tools to build end-to-end reporting solutions.

Apply AI to Your Power BI Workflow – Use Copilot and Claude to speed up reporting, automate routine tasks, and validate your work.

Master SQL for Scalable Data Management – Query, clean, and structure data for efficient reporting.

Automate Reporting & Workflows –Streamline tasks with VBA, Power BI.

Leverage Python for Advanced Data Processing – Transform and enrich data for deeper insights.

Web Scraping with VBA – Automate data extraction from websites for seamless report integration.

Integrate & Optimize Multi-Source Data – Connect APIs, SQL, Excel, and web data into unified BI systems.

Build Scalable, IT-Free BI Solutions – Deliver self-sustaining reports and automation-driven dashboards.

A snapshot of what you'll be learning in 1-year.

Course Syllabus Overview

Quick Excel brush-up

Objective: To prepare a quick POC with small data and get the concurrence on the output before investing time on huge datasets.

Overview

  • Core Fundamentals Of Spreadsheets
  • How System Interprets Your Data
  • Crucial Formatting Concepts
  • Understanding Core Formula Fundamentals & Advanced Referencing Concepts
  • 60+ Advanced Excel Functions
  • Cleansing & Transforming Data
  • Data Summarization
  • Conditional Summarization
  • Working With Multiple Datasets
  • Working With Pivot Tables Including Advanced Pivot Tables Options
  • 15+ Charts - When To Use What Chart?
  • Develop Data Models to Simulate Complex Business Scenarios for What IF Analysis

Modeling with Power Pivot

Objective: To do faster queries, simpler DAX code and enjoy easier maintenance.

Introduction To PowerPivot

  • Limitation Of Excel Functions
  • Limitation Of Excel Pivot table
  • Why Powerpivot?
  • Powerpivot Features – Overview

Powerpivot Environment

  • Opening Powerpivot Environment
  • Understanding External Data Section
  • Understanding Formatting
  • Powerpivot Views
  • Understanding Measures

Loading Data Into PowerPivot

Calculated Columns

  • Calculated Columns
  • Entering Formulas
  • Using Autocomplete Feature
  • Renaming Columns
  • Understanding Tables

Creating Measures

  • Creating Simple DAX Measures
  • Explicit Measure Vs Implicit Measure
  • Referencing Measures In Other Measures
  • Formatting Measures
  • Manage Data Relationships
  • Working With Multiple Tables
  • Disconnected Tables
  • Creating Custom Calendars
  • Using Advanced Filter()
  • Advanced Calculated Columns
  • Understanding Relationship Concept
  • Join Tables
  • Left Join Tables
  • Right Join Tables

Data Visualization Using

  • Charts, Score Cards And Dashboards
  • Slicers
  • Map Visualizations
  • Data Binding And Formatting

Creating Advanced Dashboards With PowerPivot

Creating Free Form Reports With PowerPivot & Excel

Develop Simple Models And Forecast Data Using PowerPivot & Excel

Modern Functions

Duration – 2 Hours

Dynamic Array Functions

  • FILTER
  • SORT
  • SORTBY
  • UNIQUE
  • SEQUENCE
  • RANDARRAY

Lookup & Reference Functions

  • XLOOKUP
  • XMATCH

Text Functions

  • TEXTSPLIT
  • TEXTJOIN
  • TEXTBEFORE
  • TEXTAFTER
  • CONCAT

Logical Functions

  • IFS
  • SWITCH
  • LET
  • LAMBDA

Math & Trigonometry Functions

  • MAP
  • REDUCE
  • SCAN

Array Manipulation Functions

  • VSTACK
  • HSTACK
  • CHOOSECOLS
  • CHOSEROWS
  • WRAPROWS / WRAPCOLS

Power BI

Objective: Getting started with Power BI and leverage it’s full potential to develop compelling visualizations.

Building Blocks of Power BI

  • Visualizations
  • Datasets
  • Reports
  • Dashboards
  • Tiles

Building Your First Power BI Report

  • Connect to Data Sources in Power BI Desktop
  • Clean and Transform Your Data With the Query Editor
  • Create a report in Power BI Desktop
  • Publish the report in the Power BI service

Data Modeling with Power BI

  • Fundamentals of Modeling
  • How to Manage Your Data Relationships
  • Create Calculated Columns
  • Optimizing Data Models for Better Visuals
  • Create measures and work with time-based functions
  • Create Calculated Tables
  • Explore Time-Based Data

Visualizations

  • Create and Customize Simple Visualizations

Building compelling data visualizations

  • Identify metrics and pair them with appropriate data visuals
  • Using slicers
  • Creating Map Visualizations
  • Creating Tables and Matrixes
  • Creating Scatter Charts
  • Creating Waterfall and Funnel Charts
  • Using Gauges and Single Number Cards
  • Charting Options including Formatting with Colors, Shapes, Text Boxes, Images, etc.

Designing User-friendly reports

  • Customize themes
  • Create versatile layouts for your reports
  • Design principles to reduce noise and highlight data stories

Creating interactive reports for data exploration

  • Filtering & drilling for insights
  • Difference between filters & slicers
  • Filter pane for reporting needs

Exploring Data

  • Use Quick Insights in the Power BI service
  • Create and Configure A Dashboard
  • Share Dashboards with your organization
  • Display Visuals and Tiles Full-Screen 

Power Query

Objective: To learn different methods to Transform Data before uploading it to the SQL Database.

Overview

  • Introduction
  • Loading & Refresh
  • Combine data from multiple data sources

Data Transformation

  • Editing Queries Created with Power Query
  • Editing Column Headers in Power Query
  • Splitting Column Data with Power Query
  • Sorting Data
  • Multi-Level Sorting
  • Filtering Data
  • Aggregate data from a column
  • Insert a custom column into a table
  • Merge columns
  • Remove columns
  • Remove rows with errors
  • Promote a row to column headers
  • Transforming Text Values
  • Replacing Data
  • Using the Fill command
  • Pivot and Unpivot Column
  • Transpose Query Data
  • Pivot Column Command in Action
  • Unpivot Columns Command
  • Grouping Data
  • Create a Duplicate Query
  • Group and Summarize Data
  • Advanced Data Grouping
  • Working with multiple sources in Power Query
  • Multiple Excel Tables
  • Expand a column containing an associated table
  • Understanding Table Relationships
  • Merging Queries

Loading Power Query Data to Destinations

  • Familiarity with the Load & Refresh Settings
  • Loading it to Workbook
  • Loading it to Data Model

DAX Functions

Objective: To add analytical power to your Power BI model that is not available in the data as-is, using DAX.

Overview

  • What is DAX?
  • Data Types
  • Table-Valued Functions
  • Building a Calendar Table
  • Date and Time Functions
  • Filter Functions
  • Information Functions
  • Logical Functions
  • Mathematical and Trigonometric Functions
  • Statistical Functions
  • Text Functions
  • Time Intelligence Functions

Creating Advanced Dax Measures With Advanced Dax Functions

  • Calculate()
  • All()
  • Filter()
  • IF()
  • Switch()
  • SumX()

Evaluation Context

  • Filter Context
  • Row Context
  • Using RELATED in a Row Context
  • Filters and Relationships
  • USERELATIONSHIP

Hierarchies in DAX

Querying with DAX

Relationships

  • One-to-Many Relationships
  • Many-to-Many Relationships

T-SQL

Objective: To query MS-SQL Database (es) by writing accurate, effective, and robust T-SQL code - the right way.

Introduction to MS-SQL

  • Creating a Database
  • Understanding Tables and Creating Tables
  • Inserting, Updating and Deleting Data
  • Querying Data
  • Filtering Data
  • Grouping Data
  • Ordering Data
  • Column Aliases
  • Table Aliases

DDL INSIGHTS

  • CREATE TABLE
  • Dropping Objects
  • CREATE INDEX
  • TEMPORARY OBJECTS
  • Object Naming and Dependencies

SELECT STATEMENTS

  • Simple SELECTs
  • Calculated and Derived Fields
  • SELECT TOP / BOTTOM Records
  • Derived Tables
  • Joins
  • Predicates
  • Subqueries
  • Aggregate Functions
  • GROUP BY and HAVING
  • UNION
  • ORDER BY

Advanced DAX Expressions

Objective: Leverage DAX potential to perform advanced data analytics

Advanced Table Manipulation Functions

  • ADDCOLUMNS
  • CROSSJOIN
  • DATATABLE
  • DISTINCT column
  • EXCEPT
  • FILTERS
  • GENERATESERIES
  • INTERSECT
  • NATURALINNERJOIN
  • NATURALLEFTOUTERJOIN
  • ROW
  • SELECTCOLUMNS
  • SUMMARIZE
  • SUMMARIZECOLUMNS
  • Constructor
  • TOPN
  • UNION
  • VALUES

Advanced Filter Functions

  • ADDMISSINGITEMS
  • ALL
  • ALLCROSSFILTERED
  • ALLEXCEPT
  • ALLSELECTED
  • CALCULATE
  • DISTINCT
  • FILTER
  • FILTERS
  • RELATED
  • REMOVEFILTERS
  • SELECTEDVALUE
  • USERELATIONSHIP
  • VALUES

ADVANCED USAGE OF

  • CALCULATE
  • SUMX
  • COUNTX
  • AVERAGEX
  • MAXX
  • MINXX
  • DATATABLE

Power BI Administration

Objective: Get hands-on experience with advanced administration settings, permissions, Data refresh times etc.

Overview

  • Publishing Power BI Reports
  • Creating & Managing Workspaces and Its Access
  • Creating & Managing Dashboard and Its Access
  • Installing & Configuring Data gateway
  • Scheduling and configuring data refresh
  • Managing & Reusing Datasets
  • Scheduling Report Alerts
  • Setting up Row Level Permissions
  • Managing Users & Audit Log
  • Custom Branding Power BI For your Organization
  • Adding Custom Visuals for your Organization

Architect Power BI Solution

Objective: To put our entire learning to use and arrive at the best possible BI solution -using the right combination of available technologies.

Overview

  • Case Study 1
  • Case Study 2
  • Case Study 3

AI-Powered BI with Microsoft Copilot (New)

AI-Powered BI with Microsoft Copilot
  • Introduction to Copilot in Power BI
  • Generating DAX measures using natural language prompts
  • Building report pages with Copilot (conversational report creation)
  • AI-generated narrative summaries for dashboards
  • Preparing your semantic model for Copilot (data prep for AI)
  • Smart Narratives and Q&A visuals
  • Copilot licensing and organizational requirements

Supercharging BI with Claude AI (New)

Supercharging BI with Claude AI
  • Claude for data analysis: uploading, cleaning, and exploring datasets
  • Writing and debugging DAX with Claude
  • Generating SQL queries from natural language using Claude
  • Interpreting analytical results and statistical outputs with Claude
  • Creating executive-ready data narratives and summaries
  • Claude vs. Copilot: when to use which tool
  • Building an AI-augmented BI workflow (bringing it all together)

VBA Macro Automation

Objective: To collect data from multiple ad-hoc sources and prepare it for loading it to SQL Database for BI Reporting purpose.

Overview

  • Core Fundamentals of VBA
  • Understanding VBA Environment
  • Writing simple VBA Codes
  • Concept of Variables & Data Types
  • Testing & Debugging Code
  • Understanding Fundamental Coding Blocks
  • IF Block
  • Select Case
  • And / Or Conditions
  • Understanding Fundamentals of Looping
  • For Loop
  • Do While
  • Understanding Object Based Programming
  • Advanced Excel Automations
  • Word Automation
  • Outlook Automation
  • Working with Database
  • Working with Web Browsers - Web Scrapping
  • Creating User Interfaces with VB Forms
  • Handling Run Time Errors & Securing Code

Analyzing Data With Python

Objective: To collect data from multiple ad-hoc sources and prepare it for loading it to SQL Database for BI Reporting purpose.

Overview

  • Core Fundamentals of Python
  • Understanding Python Development Environment
  • Understanding Data Types
  • Concept of Variables & Operators
  • Functions including String, Math, Date, Time, etc
  • Files and Modules in Python
  • Understanding Fundamental Coding Blocks
  • IF Block
  • Select Case
  • And / Or Conditions
  • Understanding Fundamentals of Looping
  • For Loop
  • Do While
  • Understanding Object Oriented Programming in Python
  • Data Analysis Process
  • Python Nympy - Shape, Size, Arrays, Agregation, Comparisons, Transposing, etc
  • Reporting & Data Analysis with Power BI ,Python & SQL
  • Web Scrapping with Python

System Requirements

System Requirements:

  1. Power BI Desktop

    Free & Downloadable from Microsoft Store App

    https://www.microsoft.com/store/productid/9NTXR16HNW1T?ocid=pdpshare

  2. Excel 2016 & above with PowerPivot

    Available with Office 365 subscriptions that include desktop versions of Excel for Windows.

  3. MS-SQL Server

    https://www.microsoft.com/en-in/sql-server/sql-server-downloads

    Kindly install Developer Edition as it is full-featured free edition, licensed for use as a development and test database in a non-production environment.

  4. SQL Server Management Studio (SSMS)

    Download and install SSMS from https://learn.microsoft.com/en-us/sql/ssms/download-sql-server-management-studio-ssms?view=sql-server-ver16

  5. Secondary Monitor (optional, but recommended)

    Having a secondary monitor will greatly assist in following the pace of the trainer. It allows you to view instructions and your own workspace simultaneously, enhancing your learning experience.

fullstack courses

Taught by Microsoft Certified Trainers

All our classes are live,
hands-on and with
real-trainers.

fullstack courses

Training Schedule

Limited Seats. Registration Closing Soon

Have Questions?

Tel:

+91 9176633248

Email:

support@excelgoodies.com

Projects & Assignments

What's included?

  • 180 Hours Instructor Led Training
  • 8 Excel Reports & Models
  • 4 Power BI + DAX + PQ Based Dashboards
  • 6 Power Pivot Models
  • 12 Power BI + DAX Dashboards
  • 9 Specialized Certificates
  • 6 Power Query Projects
  • 3 Power BI + DAX + PQ + SQL Based Dashboards
  • 14 VBA Automation Scenarios
  • 5 MS-SQL Projects
  • 9 Master Projects Using Power BI, DAX, PQ, SQL, VBA, Web-Scrapping, API Integration, Python etc.

Upcoming Batch

Starts On

Time

Course Fee

₹4,000 / month

with initial fee of INR 15,000.

Plus GST for Company-Sponsored.

FAQs

This is not just a Power BI course—it’s a Full Stack BI & Automation program designed for end-to-end reporting solutions. Along with Power BI & Advanced DAX, you’ll master:

  • SQL for structured data management & querying
  • Python for automation & advanced data transformation
  • VBA for automating Excel & Power BI tasks
  • Web Scraping & API Integration for real-time external data
  • End-to-end reporting frameworks that eliminate manual work

This course transforms you from a Power BI user into a BI & Automation Specialist—capable of building scalable, automated reporting solutions.

No prior coding experience is required! We start from the fundamentals and progressively move to advanced topics in SQL, VBA, and Python. Whether you're a beginner or an experienced professional, you’ll gain practical, hands-on expertise.

  • Windows 10 or later (Mac support for Power BI & automation is limited)
  • Minimum 8GB RAM (16GB recommended for large datasets)
  • 64-bit Microsoft Office (needed for Power Pivot & VBA macros)
  • SQL Server (Developer Edition): Download Here
  • Python (Latest Stable Version): Download here
  • Power BI Desktop – Download here

Yes! We offer discounts for teams of 5 or more enrolling together. We also provide customized corporate training for organizations.

Contact us for group pricing.

Yes! We provide corporate invoices for employer-sponsored payments. Your company can pay via:

  • Corporate card
  • Invoice forwarded to your finance team (payment options available during sign-up)
  • Credit/Debit cards
  • Wire transfers
  • Corporate invoices for employer-sponsored payments

This course is designed for professionals and enterprises that:

  • Prefer on-premise solutions using Power BI, SQL, VBA & Python
  • Work with local databases instead of cloud-based data sources
  • Need full control over data & automation without relying on cloud services

If your company operates in a secured IT environment, this course is fully aligned with your needs.

If you're looking to integrate Power BI with Cloud automation tools like Power Automate, Power Apps, and Azure SQL, we also offer the Full Stack BI & Automation (On-Cloud) course. Many professionals start with On-Prem BI to build a strong foundation in reporting before transitioning to Cloud BI solutions.

For now, this course will equip you with the expertise to master structured data management & automation in an on-prem environment.

Yes! We work with 45+ real-world datasets across industries like finance, retail, and supply chain to ensure you can apply your skills to practical business scenarios.

Absolutely! This course is designed for professionals in finance, operations, marketing, and business analytics who want to:

  • Automate reporting & analytics
  • Integrate external data sources
  • Reduce reliance on IT teams

This program doesn’t just teach BI tools—it makes you job-ready for high-demand BI & automation roles. You’ll gain expertise in building complete reporting solutions, automating workflows, and managing enterprise-scale data—skills that set you apart from standard Power BI users.

Whether you want to transition into a BI Developer, Reporting Lead, or Automation Specialist role, this course accelerates your career path.

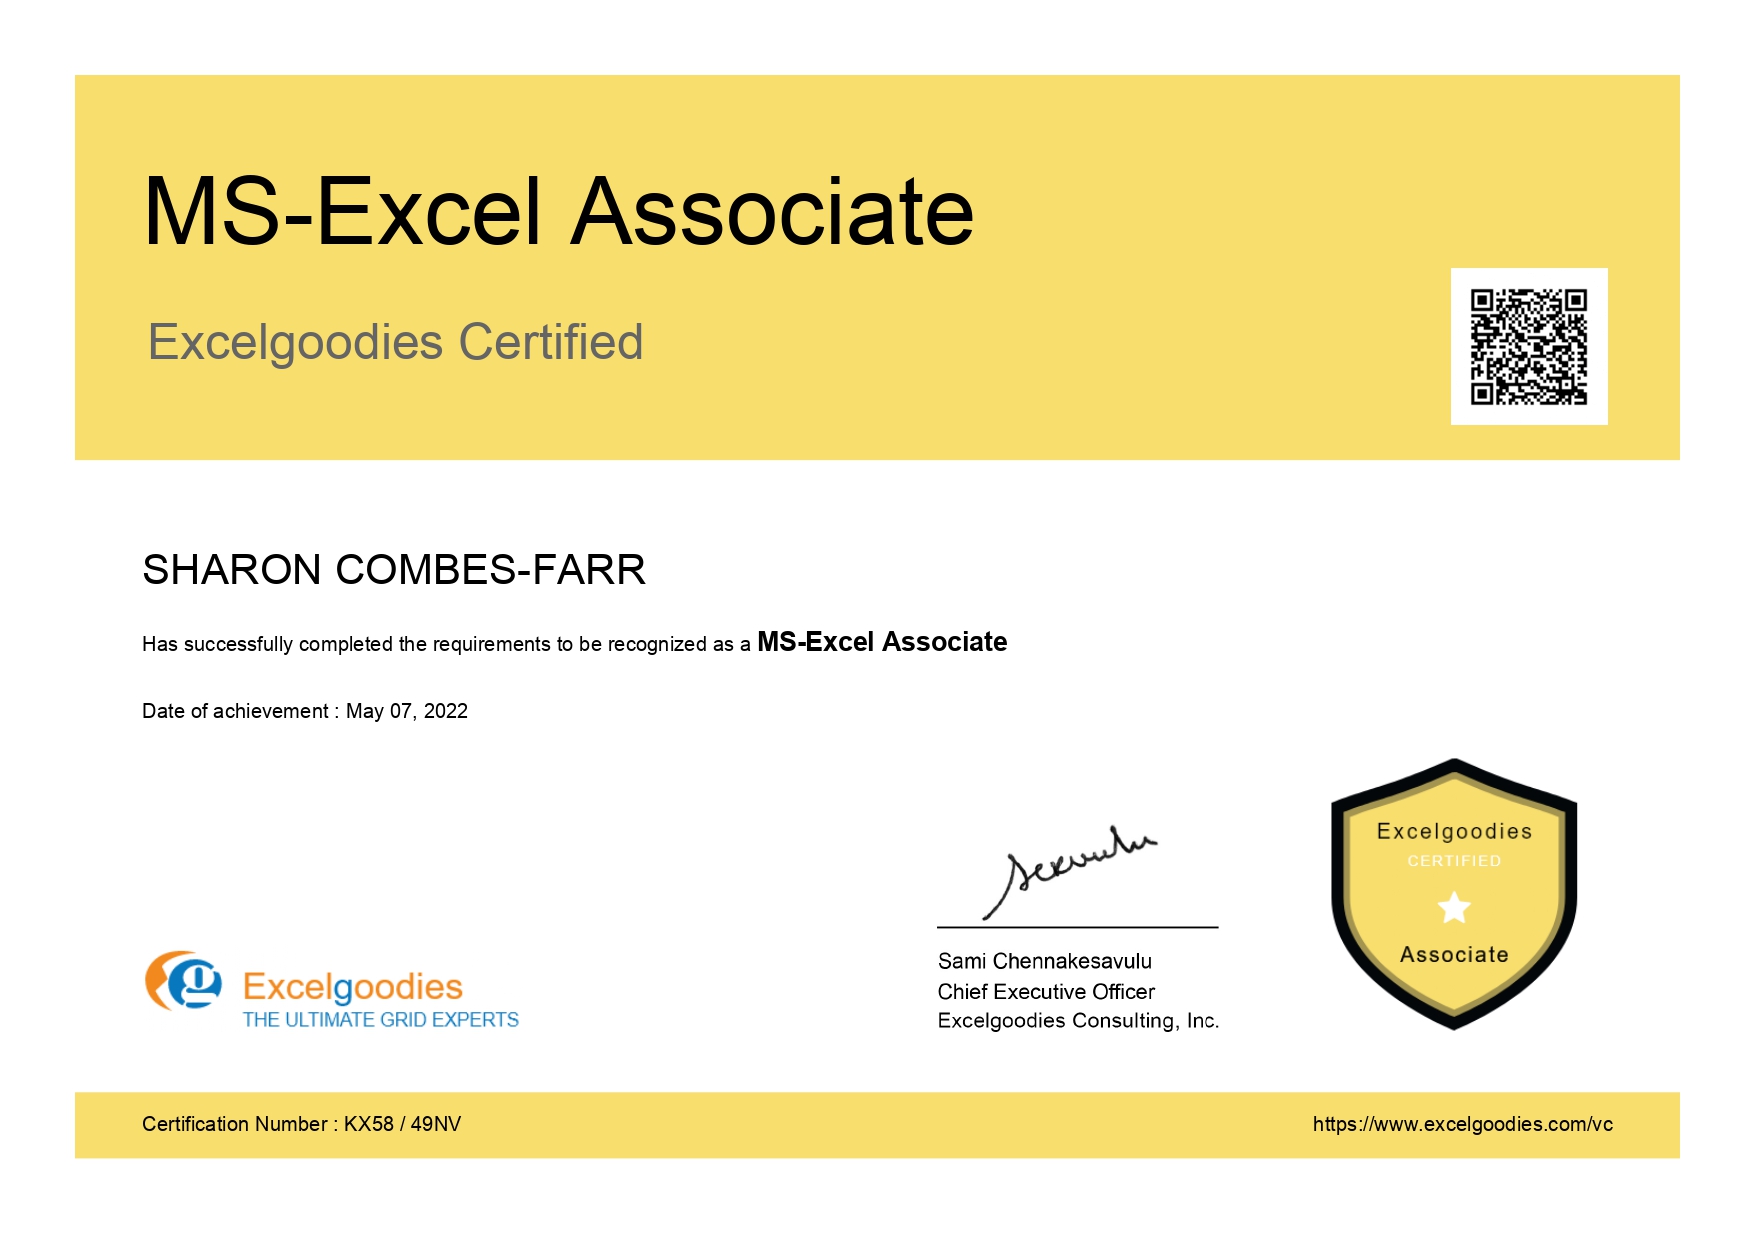
Yes! Upon successfully completing the course and final assessments, you will receive a Full Stack BI Reporting & Automation Specialist Certificate.

  • You’ll receive detailed class notes & exercises
  • You can attend the same session in a future batch (subject to availability)
  • Live, instructor-led training with hands-on exercises
  • Real-world business scenarios to apply your learning
  • Q&A discussions & troubleshootingto reinforce concepts

No, this is a live interactive course with hands-on projects. However, you’ll receive detailed assignments, documentation, and automation templates to practice.

  • You can retake specific sessions in a future batch (subject to availability)
  • Full course re-enrollment may require an additional fee

Unlike pre-recorded courses, this program is:

  • Live & interactive (hands-on learning, not just videos)
  • Business-focused, solving real-world problems
  • Instructor-led, ensuring direct support & immediate skill application

More questions ?

Gain industry-recognized credentials.

9 Specialized Certificates

Shareable certificate

Add to your LinkedIn profile

Gain industry-recognized credentials.

9 Specialized Certificates

Build Real-World Solutions During the Course

Key Skills You'll Master

Data Management & Structuring

Data Querying & Reporting

SQL Programming

Advanced Data Modeling

Database Optimization & Tuning

Automation Techniques

VBA Scripting & Automation

Data Transformation Techniques

MIS Reporting

Performance Optimization

Report Automation

Data Security Management

Business Process Automation

Solution Design for On-Prem BI Systems

About The Trainer

Mr. Sami

MCT, MCSA

15,000+

Students Trained

19+

Year of Experience

4.9

Reviews

Mr. Sami, Microsoft Certified Trainer, with his qualifications in Finance, HR & Information Technology brings in 19 years of Industry experience. He has successfully trained 15,000+ professionals by now, and the counting is still on.

He has undertaken assignments with the renowned IRS, The World Bank, Tata Chemicals, Buckman Laboratories, Standard Chartered, ING Barings and much more. His nature of going that Extra Mile has got him the startling popularity amongst the Excelgoodies prominent clients.

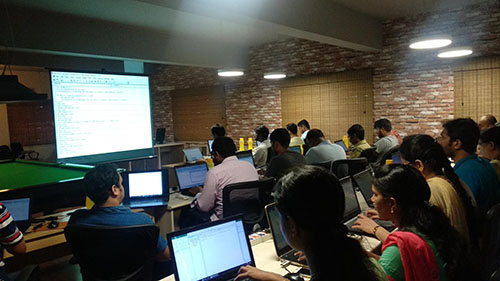
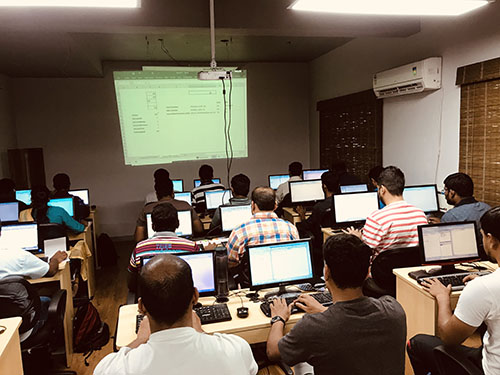
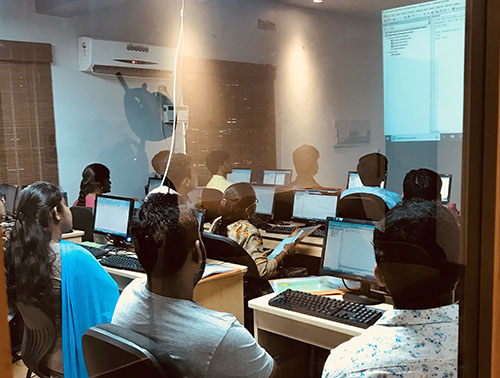
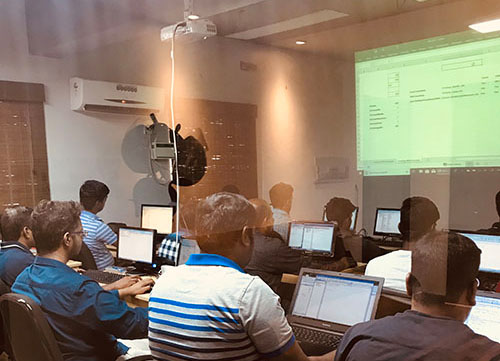
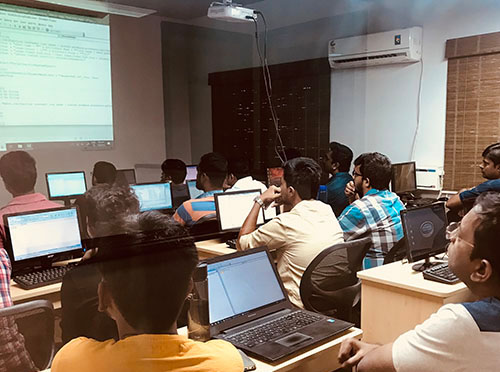
Classroom Gallery

Google Reviews

Projects on Power BI, DAX, SQL, VBA.

Real-time Projects (Practical Application)

Dive into 50+ hands-on projects designed to transform you into a full-stack reporting expert. From building interactive dashboards to automating workflows, the master projects integrate all tools, giving you the practical experience to handle complex reporting tasks and drive data-driven decision-making.

fullstack courses Power BI

fullstack courses SQL

fullstack courses VBA

fullstack courses Python

fullstack courses Master Projects

Inventory & Supply Chain Dashboard

Create dynamic visualizations that track inventory levels, order fulfillment rates, and supplier performance. Learn to automate real-time data alerts to ensure optimal stock levels and timely deliveries.

Financial Health Dashboard

Build financial dashboards that display key metrics like revenue, expenses, and cash flow, with live updates. Automate reports that compare actual vs. budget figures and offer real-time insights for business decisions.

Customer Support Dashboard

Visualize customer service metrics such as ticket status, response times, and customer satisfaction. Learn how to automate ticket updates and generate insights to improve support efficiency.

Sales Performance Dashboard

Track sales revenue, regional performance, and top-selling products using dynamic visualizations. Create automatic reports to measure progress against sales targets.


Project Management Dashboard

Design a project management dashboard that tracks timelines, budgets, and milestones in real time. Automate status updates to identify risks or delays early.

Marketing Campaign Dashboard

Build dashboards that visualize key marketing metrics, such as conversions, impressions, and ROI. Automate reports to evaluate campaign success and optimize marketing strategies.

Database Design & Normalization

Design and normalize relational databases using primary keys,foreign keys, and normal forms to optimize storage and scalability.

Customer Data Analysis

Analyze customer data with JOINs, GROUP BY, and HAVING to identify trends, segment groups, and generate insights for marketing.

Sales Data Analysis

Use window functions and CTEs to track sales metrics, revenue, and product performance, generating actionable insights.

Inventory Management Queries

Leverage subqueries, UNION, and CASE to track inventory, product stock, and sales velocity for decision-making.

Employee Performance Tracker

Apply ranking functions (e.g., RANK(), DENSE_RANK()) to evaluate employee performance, track KPIs, and enhance workforce management.

Financial Reporting Queries

Retrieve financial data using aggregate functions and GROUP BY to automate real-time reports for balance sheets and P&L statements.

Automated Excel Report Generation

Automate the creation of complex reports with VBA macros and Python scripts. Generate dynamic pivot tables, charts, and formatted summaries at the click of a button.

Email & Report Automation

Use VBA and Outlook automation to send scheduled reports based on data conditions. Ensure timely delivery of financial, sales, or operational updates.

Web Scraping & Data Collection

Automate data extraction from websites using Python (BeautifulSoup, Selenium) to collect real-time insights for competitive analysis and trend tracking.

Data Cleaning & Transformation

Leverage Python and VBA to clean and standardize raw data, automate missing value handling, and prepare datasets for reporting.

Smart Financial Generator

Use VBA and Python to extract financial data, consolidate income statements, and generate automated balance sheets with dynamic updates.

Data Cleansing Pipeline for Lakehouse

Use Python (via Notebooks in Fabric) to clean, deduplicate, and normalize raw CSV/parquet files before storing them in Delta format in the Fabric Lakehouse. Integrate with a Data Factory pipeline for scheduled ingestion.

Automated Data Quality Checks on Delta Tables

Build a reusable Python script to perform column-level validation (null checks, data types, range thresholds) on Delta tables in the Lakehouse. Automatically log failures to a monitoring table and trigger alerts.

Generate KPI Summary Tables for Power BI

Write a Python routine to compute summary KPIs (e.g., weekly sales, customer retention, churn rates) and store results in a Gold layer table. These output tables are optimized for reporting in Power BI dashboards.

Notebook-Driven ETL for Semi-Structured Data

Automate ETL for JSON or nested data (e.g., API exports, logs) using Python in a Fabric Notebook. Transform and flatten the data structure, then write the result into Delta tables for KQL/Power BI consumption.

Automated Archival and Partition Management

Use Python to periodically move older data partitions to cold storage and maintain optimized table size for querying. This improves performance and cost-efficiency within the Lakehouse.

Customer 360 Analytics & Retention Model

Analyze customer behavior by integrating sales, support, and feedback data. Use predictive modeling to identify churn risks, automate alerts, and create a dashboard that provides actionable insights to improve customer retention.

Financial Performance & Variance Analysis Dashboard

Transform financial data into a dynamic reporting system that tracks revenue, expenses, and profit margins. Automate variance analysis using SQL queries, Power Query transformations, and VBA-driven Excel reports for deeper financial insights.

Inventory & Demand Forecasting Model

Develop an automated inventory management dashboard that monitors stock levels, order trends, and supplier performance. Use SQL for historical demand analysis, DAX for forecasting, and API integration for real-time updates.

Automated Sales & Marketing Analytics Suite

Extract sales and marketing data from structured and unstructured sources, including web scraping competitor pricing. Create an automated reporting workflow that consolidates data, applies business rules, and delivers insights on campaign performance.

Fraud Detection & Risk Management System

Analyze transactional data to detect anomalies and fraudulent activities using statistical models. Use SQL queries for pattern recognition, Power BI for visualization, and API integration for real-time alerting.

Create dynamic visualizations that track inventory levels, order fulfillment rates, and supplier performance. Learn to automate real-time data alerts to ensure optimal stock levels and timely deliveries.

Build financial dashboards that display key metrics like revenue, expenses, and cash flow, with live updates. Automate reports that compare actual vs. budget figures and offer real-time insights for business decisions.

Visualize customer service metrics such as ticket status, response times, and customer satisfaction. Learn how to automate ticket updates and generate insights to improve support efficiency.

Track sales revenue, regional performance, and top-selling products using dynamic visualizations. Create automatic reports to measure progress against sales targets.

Design a project management dashboard that tracks timelines, budgets, and milestones in real time. Automate status updates to identify risks or delays early.

Build dashboards that visualize key marketing metrics, such as conversions, impressions, and ROI. Automate reports to evaluate campaign success and optimize marketing strategies.

Design and normalize relational databases using primary keys, foreign keys, and normal forms to optimize storage and scalability.

Analyze customer data with JOINs, GROUP BY, and HAVING to identify trends, segment groups, and generate insights for marketing.

Use window functions and CTEs to track sales metrics, revenue, and product performance, generating actionable insights.

Leverage subqueries, UNION, and CASE to track inventory, product stock, and sales velocity for decision-making.

Apply ranking functions (e.g., RANK(), DENSE_RANK()) to evaluate employee performance, track KPIs, and enhance workforce management.

Retrieve financial data using aggregate functions and GROUP BY to automate real-time reports for balance sheets and P&L statements.

Automate the creation of complex reports with VBA macros and Python scripts. Generate dynamic pivot tables, charts, and formatted summaries at the click of a button.

Use VBA and Outlook automation to send scheduled reports based on data conditions. Ensure timely delivery of financial, sales, or operational updates.

Automate data extraction from websites using Python (BeautifulSoup, Selenium) to collect real-time insights for competitive analysis and trend tracking.

Leverage Python and VBA to clean and standardize raw data, automate missing value handling, and prepare datasets for reporting.

Use VBA and Python to extract financial data, consolidate income statements, and generate automated balance sheets with dynamic updates.

Use Python (via Notebooks in Fabric) to clean, deduplicate, and normalize raw CSV/parquet files before storing them in Delta format in the Fabric Lakehouse. Integrate with a Data Factory pipeline for scheduled ingestion.

Build a reusable Python script to perform column-level validation (null checks, data types, range thresholds) on Delta tables in the Lakehouse. Automatically log failures to a monitoring table and trigger alerts.

Write a Python routine to compute summary KPIs (e.g., weekly sales, customer retention, churn rates) and store results in a Gold layer table. These output tables are optimized for reporting in Power BI dashboards.

Automate ETL for JSON or nested data (e.g., API exports, logs) using Python in a Fabric Notebook. Transform and flatten the data structure, then write the result into Delta tables for KQL/Power BI consumption.

Use Python to periodically move older data partitions to cold storage and maintain optimized table size for querying. This improves performance and cost-efficiency within the Lakehouse.

Analyze customer behavior by integrating sales, support, and feedback data. Use predictive modeling to identify churn risks, automate alerts, and create a dashboard that provides actionable insights to improve customer retention.

Transform financial data into a dynamic reporting system that tracks revenue, expenses, and profit margins. Automate variance analysis using SQL queries, Power Query transformations, and VBA-driven Excel reports for deeper financial insights.

Develop an automated inventory management dashboard that monitors stock levels, order trends, and supplier performance. Use SQL for historical demand analysis, DAX for forecasting, and API integration for real-time updates.

Extract sales and marketing data from structured and unstructured sources, including web scraping competitor pricing. Create an automated reporting workflow that consolidates data, applies business rules, and delivers insights on campaign performance.

Analyze transactional data to detect anomalies and fraudulent activities using statistical models. Use SQL queries for pattern recognition, Power BI for visualization, and API integration for real-time alerting.

Corporate Training

bi_report_automation_mob

Avail additional 10% Corporate Benefit on the total course fee for 5+participants.

Get you team BI ready, today.

Ms.Jayasree

Business Associate

Prove you're human: Type the code shown.

=
Excelgoodies

Esteemed Clientele

Esteemed Clientele Esteemed Clientele Esteemed Clientele Esteemed Clientele Esteemed Clientele Esteemed Clientele Esteemed Clientele Esteemed Clientele Esteemed Clientele Esteemed Clientele Esteemed Clientele Esteemed Clientele Esteemed Clientele Esteemed Clientele Esteemed Clientele Esteemed Clientele Esteemed Clientele Esteemed Clientele Esteemed Clientele Esteemed Clientele Esteemed Clientele Esteemed Clientele Esteemed Clientele Esteemed Clientele Esteemed Clientele Esteemed Clientele Esteemed Clientele Esteemed Clientele Esteemed Clientele Esteemed Clientele Esteemed Clientele Esteemed Clientele Esteemed Clientele Esteemed Clientele Esteemed Clientele Esteemed Clientele Esteemed Clientele Esteemed Clientele Esteemed Clientele Esteemed Clientele Esteemed Clientele Esteemed Clientele Esteemed Clientele Esteemed Clientele Esteemed Clientele Esteemed Clientele Esteemed Clientele Esteemed Clientele Esteemed Clientele Esteemed Clientele Esteemed Clientele Esteemed Clientele Esteemed Clientele Esteemed Clientele Esteemed Clientele Esteemed Clientele Esteemed Clientele Esteemed Clientele

Thousands Trained. Here’s What They Say.

Total Reviews 2080
Average Rating
4.5
Excelgoodies Excelgoodies Excelgoodies Excelgoodies Excelgoodies
Why Excelgoodies image

Thousands Trained. Here’s What They Say.

APPLICATION DEADLINE

Registration Closes
on .

Prove you're human: Type the code shown.

=
Excelgoodies

Industry Insights

Industry Insights