+91 9176633248

Courses

Batch starts on

th

Powerful Business Intelligence for all.

Power BI Training in Chennai - Data Analytics & Advanced Reporting

40-hours Course | 30-Days Project Support | View Schedule View Schedule

Program Overview

TOTAL COURSE DURATION

40-hours, 16 Sessions

3-months | Only on Weekends

TRAINING SCHEDULE

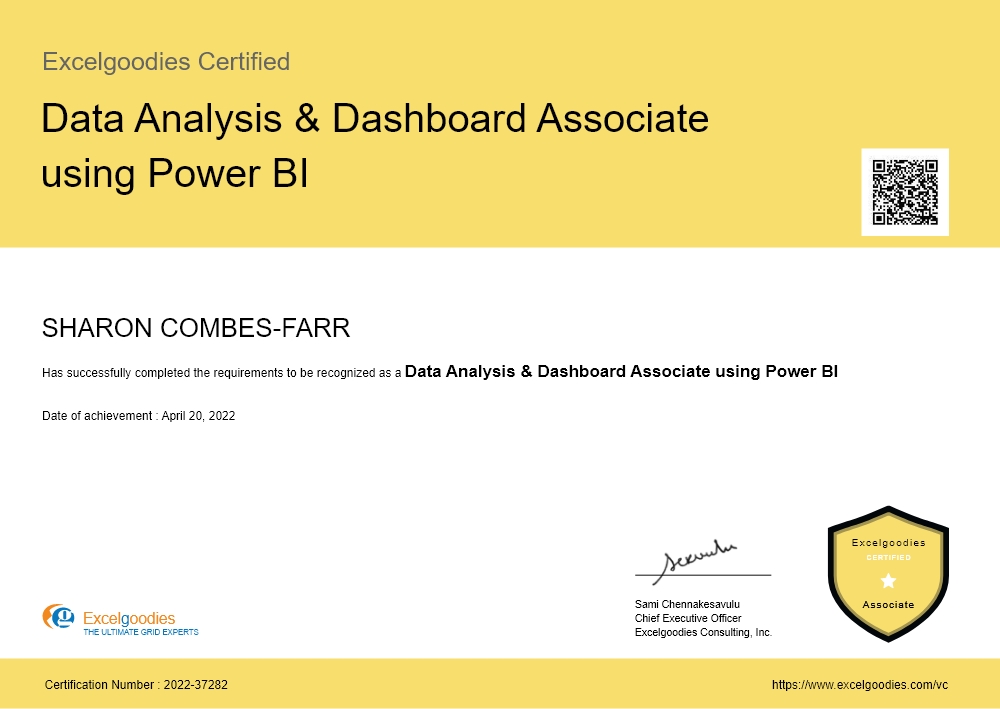
CERTIFICATE

BI Reporting Specialist

View Sample Certificate

PRE-REQUISITE

Advanced Excel Skills

Formulas & Pivots.

Both Online & Classroom is available.

*

All our classes are live, hands-on and with real-trainers.

Course Content Overview

Objective: Getting started with Power BI and leverage it’s full potential to develop compelling visualizations.

Building Blocks of Power BI

  • Visualizations
  • Datasets
  • Reports
  • Dashboards
  • Tiles

Building Your First Power BI Report

  • Connect to Data Sources in Power BI Desktop
  • Clean and Transform Your Data With the Query Editor
  • Create a report in Power BI Desktop
  • Publish the report in the Power BI service

Data Modeling with Power BI

  • Fundamentals of Modeling
  • How to Manage Your Data Relationships
  • Create Calculated Columns
  • Optimizing Data Models for Better Visuals
  • Create measures and work with time-based functions
  • Create Calculated Tables
  • Explore Time-Based Data

Visualizations

  • Create and Customize Simple Visualizations

Building compelling data visualizations

  • Identify metrics and pair them with appropriate data visuals
  • Using slicers
  • Creating Map Visualizations
  • Creating Tables and Matrixes
  • Creating Scatter Charts
  • Creating Waterfall and Funnel Charts
  • Using Gauges and Single Number Cards
  • Charting Options including Formatting with Colors, Shapes, Text Boxes, Images, etc.

Designing User-friendly reports

  • Customize themes
  • Create versatile layouts for your reports
  • Design principles to reduce noise and highlight data stories

Creating interactive reports for data exploration

  • Filtering & drilling for insights
  • Difference between filters & slicers
  • Filter pane for reporting needs

Exploring Data

  • Use Quick Insights in the Power BI service
  • Create and Configure A Dashboard
  • Share Dashboards with your organization
  • Display Visuals and Tiles Full-Screen 

Objective: To add analytical power to your Power BI model that is not available in the data as-is, using DAX.

Overview

  • What is DAX?
  • Data Types
  • Table-Valued Functions
  • Building a Calendar Table
  • Date and Time Functions
  • Filter Functions
  • Information Functions
  • Logical Functions
  • Mathematical and Trigonometric Functions
  • Statistical Functions
  • Text Functions
  • Time Intelligence Functions

Creating Advanced Dax Measures With Advanced Dax Functions

  • Calculate()
  • All()
  • Filter()
  • IF()
  • Switch()
  • SumX()

Evaluation Context

  • Filter Context
  • Row Context
  • Using RELATED in a Row Context
  • Filters and Relationships
  • USERELATIONSHIP

Hierarchies in DAX

Querying with DAX

Relationships

  • One-to-Many Relationships
  • Many-to-Many Relationships

Objective: To learn different methods to Transform Data before uploading it to the SQL Database.

Overview

  • Introduction
  • Loading & Refresh
  • Combine data from multiple data sources

Data Transformation

  • Editing Queries Created with Power Query
  • Editing Column Headers in Power Query
  • Splitting Column Data with Power Query
  • Sorting Data
  • Multi-Level Sorting
  • Filtering Data
  • Aggregate data from a column
  • Insert a custom column into a table
  • Merge columns
  • Remove columns
  • Remove rows with errors
  • Promote a row to column headers
  • Transforming Text Values
  • Replacing Data
  • Using the Fill command
  • Pivot and Unpivot Column
  • Transpose Query Data
  • Pivot Column Command in Action
  • Unpivot Columns Command
  • Grouping Data
  • Create a Duplicate Query
  • Group and Summarize Data
  • Advanced Data Grouping
  • Working with multiple sources in Power Query
  • Multiple Excel Tables
  • Expand a column containing an associated table
  • Understanding Table Relationships
  • Merging Queries

Loading Power Query Data to Destinations

  • Familiarity with the Load & Refresh Settings
  • Loading it to Workbook
  • Loading it to Data Model

Objective: Power Query and Power Pivot complement each other. Power Query is the recommended experience for discovering, connecting to, and importing data. Power Pivot is great for modeling the data you’ve imported.

INTRODUCTION TO POWERPIVOT

  • Limitation of Excel Functions
  • Limitation of Excel PivotTable
  • Why PowerPivot?
  • PowerPivot Features - Overview

POWERPIVOT ENVIRONMENT

  • Opening PowerPivot Environment
  • Understanding External Data Section
  • Understanding Formatting
  • PowerPivot Views
  • Understanding Measures

TAKING DATA INTO POWERPIVOT

  • From Excel
  • From MS Access
  • From Ms-SQL
  • From Custom Query
  • From Text Files
  • From Other Sources

CALCULATED COLUMNS

  • Calculated Columns
  • Entering Formulas
  • Using AutoComplete Feature
  • Renaming Columns
  • Understanding Tables

ADVANCED CALCULATED COLUMNS

  • Understanding Relationship Concept
  • JOIN TABLES
  • LEFT JOIN TABLES
  • RIGHT JOIN TABLES
  • Using UNION QUERIES

DATA VISUALIZATION USING

  • Power View
  • Charts, Score Cards and Dashboards
  • Slicers
  • Map Visualizations
  • Data Binding and Formatting

Objective: To perform advanced and complex data transformations not available in the Query Editor

Understanding M Programming Code

  • M LANGUAGE Specifications
  • Lexical Structure
  • Basic Concepts
  • Values
  • Types
  • Operators
  • Let
  • Conditionals
  • Functions
  • Error Handling
  • Creating Simple M Expressions
  • Creating Simple M Functions
  • Working with List, Record & Tables
  • Understanding Operators and Evaluation Methods
  • Data Types & Type Conversions

Working with M Functions

  • ACCESSING DATA FUNCTIONS - From Excel, SQL, CSV, Tab-Delimited, Webpage, XML, JSON, SharePoint, etc.
  • COMBINER FUNCTIONS
  • COMPARER FUNCTIONS
  • DATE FUNCTIONS
  • DATETIME FUNCTIONS
  • DURATION FUNCTIONS
  • LIST FUNCTIONS
  • LOGICAL FUNCTIONS
  • NUMBER FUNCTIONS
  • RECORD FUNCTIONS
  • REPLACER FUNCTIONS
  • SPLITTER FUNCTIONS
  • TABLE FUNCTIONS
  • TEXT FUNCTIONS
  • TIME FUNCTIONS
  • TYPE FUNCTIONS
  • VALUE FUNCTIONS

Objective: Get hands-on experience with advanced administration settings, permissions, Data refresh times etc.

Overview

  • Publishing Power BI Reports
  • Creating & Managing Workspaces and Its Access
  • Creating & Managing Dashboard and Its Access
  • Installing & Configuring Data gateway
  • Scheduling and configuring data refresh
  • Managing & Reusing Datasets
  • Scheduling Report Alerts
  • Setting up Row Level Permissions
  • Managing Users & Audit Log
  • Custom Branding Power BI For your Organization
  • Adding Custom Visuals for your Organization

Objective: It complements Power Pivots and Power BI better than any other DB.

INTRODUCTION TO MS-SQL

  • Creating a Database
  • Understanding Tables and Creating Tables
  • Inserting, Updating and Deleting Data
  • Querying Data
  • Filtering Data
  • Grouping Data
  • Ordering Data
  • Column Aliases
  • Table Aliases

UNDERSTANDING TRANSACT-SQL DATA TYPES

  • Dates
  • Strings
  • Numeric
  • BLOBs
  • Bits
  • UNIQUEIDENTIFIER
  • Cursor Variables
  • Timestamps

DDL INSIGHTS

  • CREATE TABLE
  • Dropping Objects
  • CREATE INDEX
  • TEMPORARY OBJECTS
  • Object Naming and Dependencies

SELECT STATEMENTS

  • Simple SELECTs
  • Calculated and Derived Fields
  • SELECT TOP / BOTTOM Records
  • Derived Tables
  • Joins
  • Predicates
  • Subqueries
  • Aggregate Functions
  • GROUP BY and HAVING
  • UNION
  • ORDER BY

Objective: To put our entire learning to use and arrive at the best possible BI solution -using the right combination of available technologies.

Overview

  • Case Study 1
  • Case Study 2
  • Case Study 3

Power BI Training in Chennai – Training Schedule

Session Date Time

Course Fee

INR 15000 (Initial Fees)

4000 / month (for 2-months)

What is included?

  • 40 hours of Instructor-led training.
  • Power BI & Power Query Projects & related case studies.
  • 30-Days post training support (via Email).
  • BI Reporting Specialist Certificate
View Certificate

About the Trainer

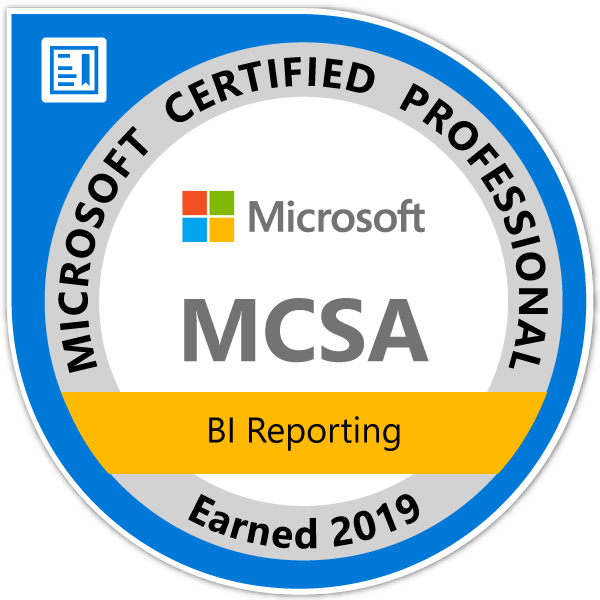
Mr. Sami, MCT, MCSA Data Enthusiast & a Technophile

Trainer's certificate Trainer's certificate

Mr. Sami, Microsoft Certified Trainer, with his qualifications in Finance, HR & Information Technology brings in 14 years of Industry experience. He has successfully trained 9500+ professionals by now, and the counting is still on.

He has undertaken assignments with the renowned IRS, The World Bank, Tata Chemicals, Buckman Laboratories, Standard Chartered, ING Barings and much more. His nature of going that Extra Mile has got him the startling popularity amongst the Excelgoodies prominent clients.

FAQ's

Power BI is Microsoft’s leading data visualization and business intelligence tool. It helps users analyze data, build interactive dashboards, and generate real-time insights for smarter decision-making. From IT to finance and operations, Power BI is widely used in Chennai’s corporate ecosystem to automate reporting and make data-driven decisions.

You’ll gain end-to-end Power BI skills, including:

  • Power Query for data transformation
  • DAX for advanced calculations
  • Data modeling techniques
  • Dashboard building with real-time visuals
  • Publishing and sharing reports via Power BI Service

By course end, you’ll be ready to build automated, interactive reports from scratch.

This course is perfect for:

  • MIS and reporting professionals
  • Finance, HR, and business managers
  • Fresh graduates entering analytics
  • Non-IT professionals looking to upskill

Basic Excel knowledge is enough to get started, and our free brush-up ensures no one is left behind.

The total course fee is INR 23,000, structured as:

  • ₹15,000 upfront
  • ₹4,000 per month for the next two months

This pocket-friendly EMI option makes it easier for learners across Chennai to access premium training without a financial burden.

We offer a comprehensive Power BI course tailored to Chennai’s job market, including:

  • Live weekend sessions (3-months)
  • Certification: Power BI Associate – Data Analysis & Dashboards
  • 15+ dashboards & 5 reporting projects
  • Excel refresher at no extra cost
  • EMI-based fee payment

Our Chennai learners love our structured approach and real-world projects.

No. Power BI does not require coding to get started. It uses an intuitive interface and Excel-like functions. For learners who are new to data, Excelgoodies offers a free Excel brush-up session to ensure you’re comfortable before diving into Power BI concepts.

You can cover the basics of Power BI in a few days, but true mastery of data modeling, Power Query, and DAX requires structured learning. That’s why Excelgoodies offers a 12-session, 3-month weekend course, helping you progress from beginner to job-ready with hands-on practice.

Excelgoodies is recognized as one of the best Power BI training institutes in Chennai, known for:

  • Live instructor-led weekend classes
  • Real-world dashboards and reporting projects
  • Free Excel brush-up sessions
  • Affordable EMI model
  • Certification and career guidance

With 17+ years of specialization in analytics and reporting, we are trusted by students and professionals alike.

To attend Excelgoodies’ Power BI course, you’ll need:

  • Windows 10 or later
  • Minimum 4GB RAM (8GB recommended)
  • Microsoft Excel 2016 or higher
  • Internet connection with Zoom access

No advanced configuration is needed—standard laptops work well.

Excelgoodies offers live, instructor-led online training for learners in Chennai. Classes are conducted over Zoom during weekends. This format gives you the benefit of real-time interaction from the comfort of your home.

Yes. The course includes:

  • 15+ Power BI dashboards covering various industries
  • 5 real-time reporting projects

You’ll apply what you learn to real datasets—ideal for building your portfolio and gaining practical experience.

Yes. On successful completion, you’ll receive the “Power BI Associate – Data Analysis & Dashboards” certificate from Excelgoodies, adding value to your resume and LinkedIn profile.

Yes. Excelgoodies offers an EMI option:

  • ₹15,000 initial payment
  • ₹4,000/month for 2 months

This structure is designed to make high-quality training affordable for Chennai-based students and professionals.

You’ll be eligible for roles like:

  • Data Analyst
  • Power BI Developer
  • Business Intelligence Analyst
  • MIS Executive
  • Reporting & Dashboard Specialist

These roles are in high demand across Chennai’s growing data and analytics industry.

Entry-level Power BI professionals in Chennai earn ₹4–6 LPA, while experienced candidates with strong DAX, SQL, and reporting skills can command ₹8–12 LPA or more. Excelgoodies prepares you to compete confidently in this talent-driven market.

Yes, Power BI is in high demand across Chennai, especially in IT hubs like Tidel Park, OMR, and Guindy. Companies are rapidly adopting Power BI for automated reporting, real-time dashboards, and decision support, creating opportunities for skilled professionals.

Top companies actively hiring Power BI talent in Chennai include:

  • TCS
  • Infosys
  • Zoho
  • Cognizant
  • Accenture
  • L&T Infotech
  • Freshworks
  • Capgemini

These firms regularly post openings for BI Developers, MIS Analysts, and Data Visualization Specialists.

While we are not a placement agency, we support learners with:

  • Resume and LinkedIn profile optimization
  • Mock interviews and feedback
  • Referral opportunities through our corporate network

Many of our students have successfully transitioned into Power BI roles post-training.

power-bi-training-in-chennai FAQ's

For more questions?

Call: +91 9176633248

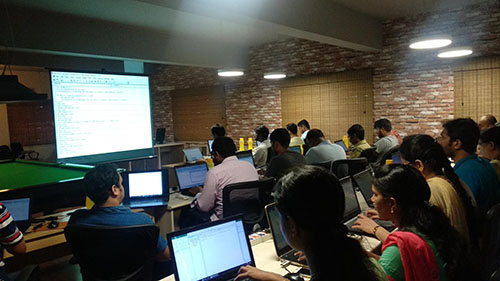
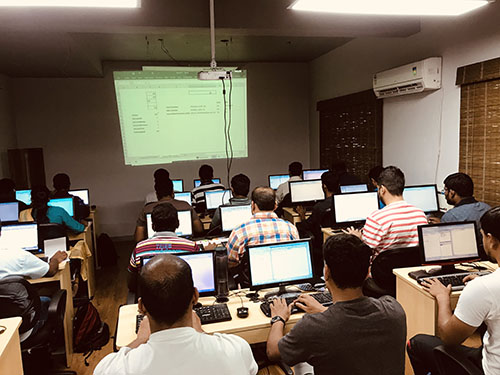
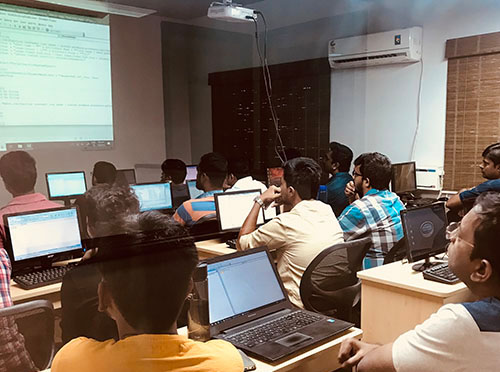
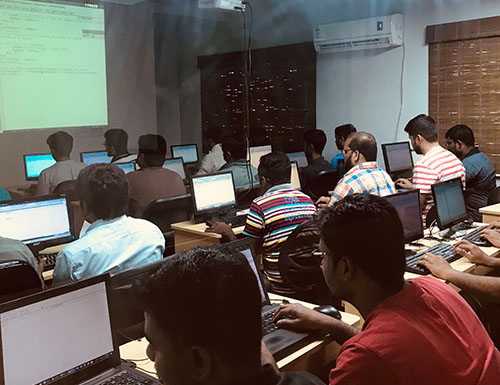
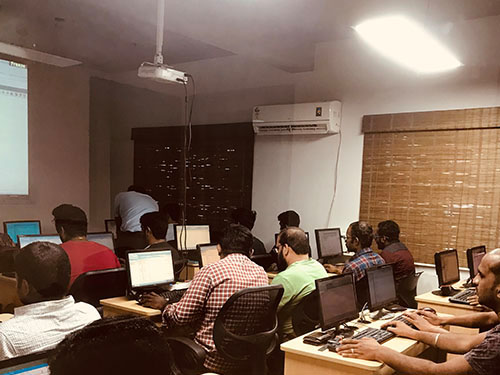
Classroom Gallery

Why Power BI skill is highly sought after?

Excelgoodies

INR 12,84,448

is the annual average salary of

Data Scientist using Power BI

Excelgoodies

2,50,000

Companies have

implemented Power BI

Excelgoodies

97%

Fortune 500 Companies use

Power BI

Excelgoodies

Top Leader

in Analytics & BI for 14th

Consecutive Year.

Source:

Excelgoodies Excelgoodies Excelgoodies

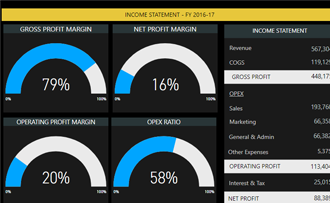
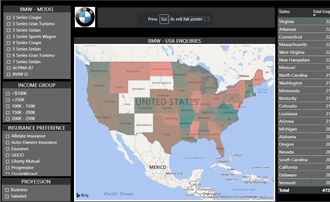
Few Real­world Use Cases of Power BI Reporting

Get a full picture across data sources in seconds. Click to drill down

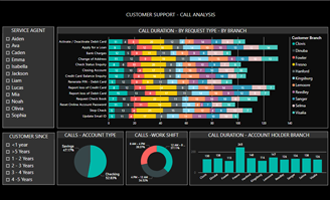
Few Real­world Use Cases of Power BI Reporting

Get a full picture across data sources in seconds. Click to drill down

Resources from our Power Users.

Excelgoodies
Is Power Bi, the silent death of SSRS?

Well, the end-purpose of both tools is to help business users with high-end reporting. Where does the difference lie? The changing role of Business Users from just “receiving” the powerful…

Power BI Blog
Excelgoodies
7 Advanced DAX Functions to Supercharge Your Power BI Reports

Business intelligence (BI) reporting and automation are powerful tools that can significantly improve business processes by providing real-time insights, automating repetitive tasks, and reducing the risk of human error.

Power BI Blog
Excelgoodies
Creating Mobile-Friendly Reports with Power BI

Power BI is a powerful tool for creating reports that can be accessed on desktops, tablets, and mobile devices.

Power BI Blog
Excelgoodies
The Fast-Food Chain Data Story: Do’s & Don’ts of data storytelling.

Suppose you are a marketing analyst for a fast food chain, and your task is to create a data story to help the company understand the behavior of its customers

Power BI Blog

APPLICATION DEADLINE

Application Deadline

Registration Closes on
, .

Registration Closes on .

View More Google Reviews

Google Reviews

Recommended Course (For Advanced Reporting Users Only)

Full Stack BI R
Reporting & Automation Course.

72 Sessions | 9-Specialist Certifications

You will learn to use the right and hybrid technology for end-to-end advanced power reporting.

Tools: Power BI, Power Pivot, VBA, Excel,
M-Programming, MS-SQL, SSIS, and many more.

Excelgoodies

Power BI

Excelgoodies

Micorsoft T-SQL

Excelgoodies

MS-SQL Integrated Services

Excelgoodies

Python

Excelgoodies

Microsoft Excel VBA

Excelgoodies

MS-Excel

Excelgoodies

Power Query